I left legacy media to build something different: independent, honest political analysis with no corporate or partisan agenda.
I call balls and strikes ⚾ — because politics needs referees, not cheerleaders.
If you want clear, concise analysis that cuts through the noise, subscribe today. You’ll get what actually matters—not just what people want you to hear. 🎯
Subscribe now
Don’t forget to like and subscribe to “Super Tuesdays” — the weekly podcast from me and Chuck Todd!
I am still digging out from Tuesday night. (Note: I slept until 9:30 am this morning!)
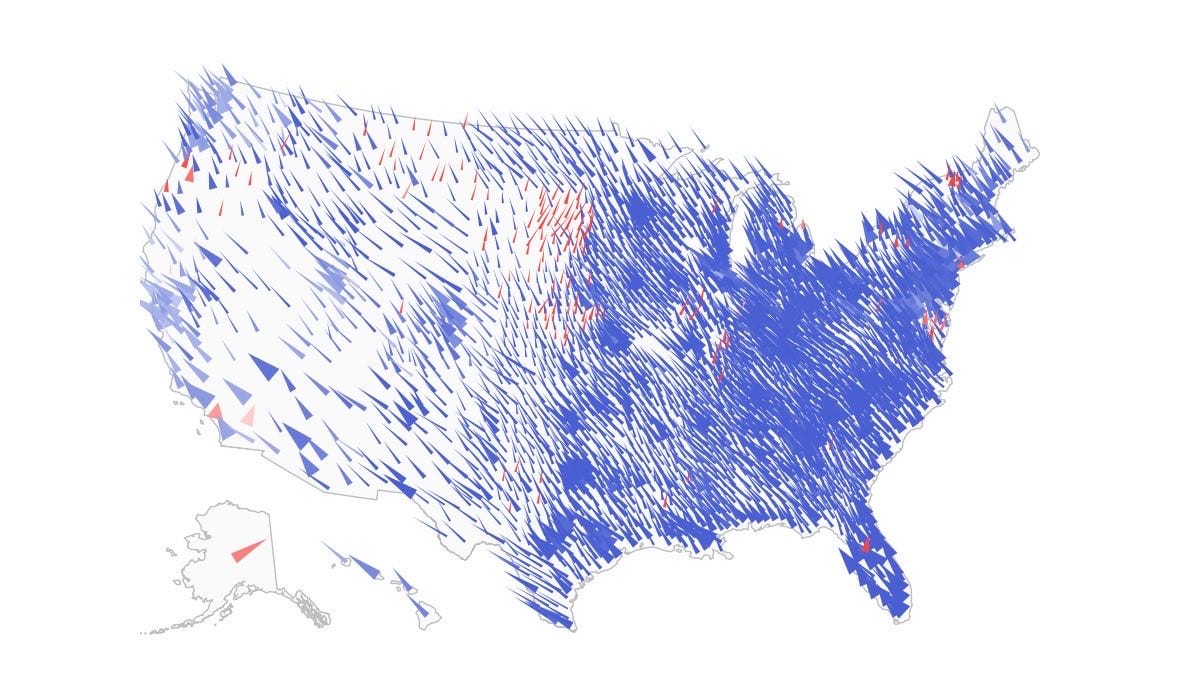
And while I am going to have a LOT more to say about the most consequential midterm of my lifetime — I was born in 1976, two years after the post-Watergate blowout of 1974 — I wanted to first share a bunch of charts I’ve collected over the last few days that, to me, tell the real story of what happened on November 3.
They’re below.
Got a cool chart I missed/should see? Send it to me here: Chris@cheneyroadmedia.com!
Here. We. Go.
1. It’s the Economy, Stupid (Part 1)
This chart — via WaPo pollster Scott Clement — contains multitudes. The light pink line shows why Donald Trump got re-elected in 2024: People thought he had done a good job on the economy. Period. The darker red line shows why Republicans got walloped on Tuesday: The American public had turned — hard — against how the president was handling the economy.
Subscribe now
Read more