Three months ago, I wrote a post “setting up the goal posts” to measure how individual candidates did in the midterms. I did that for two reasons: First, I did it to be a dick. I feel that liberals can be too polite, and we bite our tongues in response to the hate and idiocy that DSA types are trying to smuggle into the mainstream — I see a role for a tactless dickweed (me) to say “These clowns are clowns.” Second, I did it because I assumed that Democrats would do well in the midterms, and that left-populists would try to spin that success as proof that Americans are pining for full communism. And, here we are:
Personally, I’d give more credit to the 𝕏hoard of establishment Democrats who rode to the rescue of flagging candidates like Abdul El-Sayed than to a blue city mayor who — to my knowledge — didn’t campaign with anyone outside of New York. Of course, the whole reason I wrote and revisited* *my “setting up the goalposts” column was to make debates like this one irrelevant. We can have this pointless pissing match some other time — today, we have data. So, let’s look at that data.
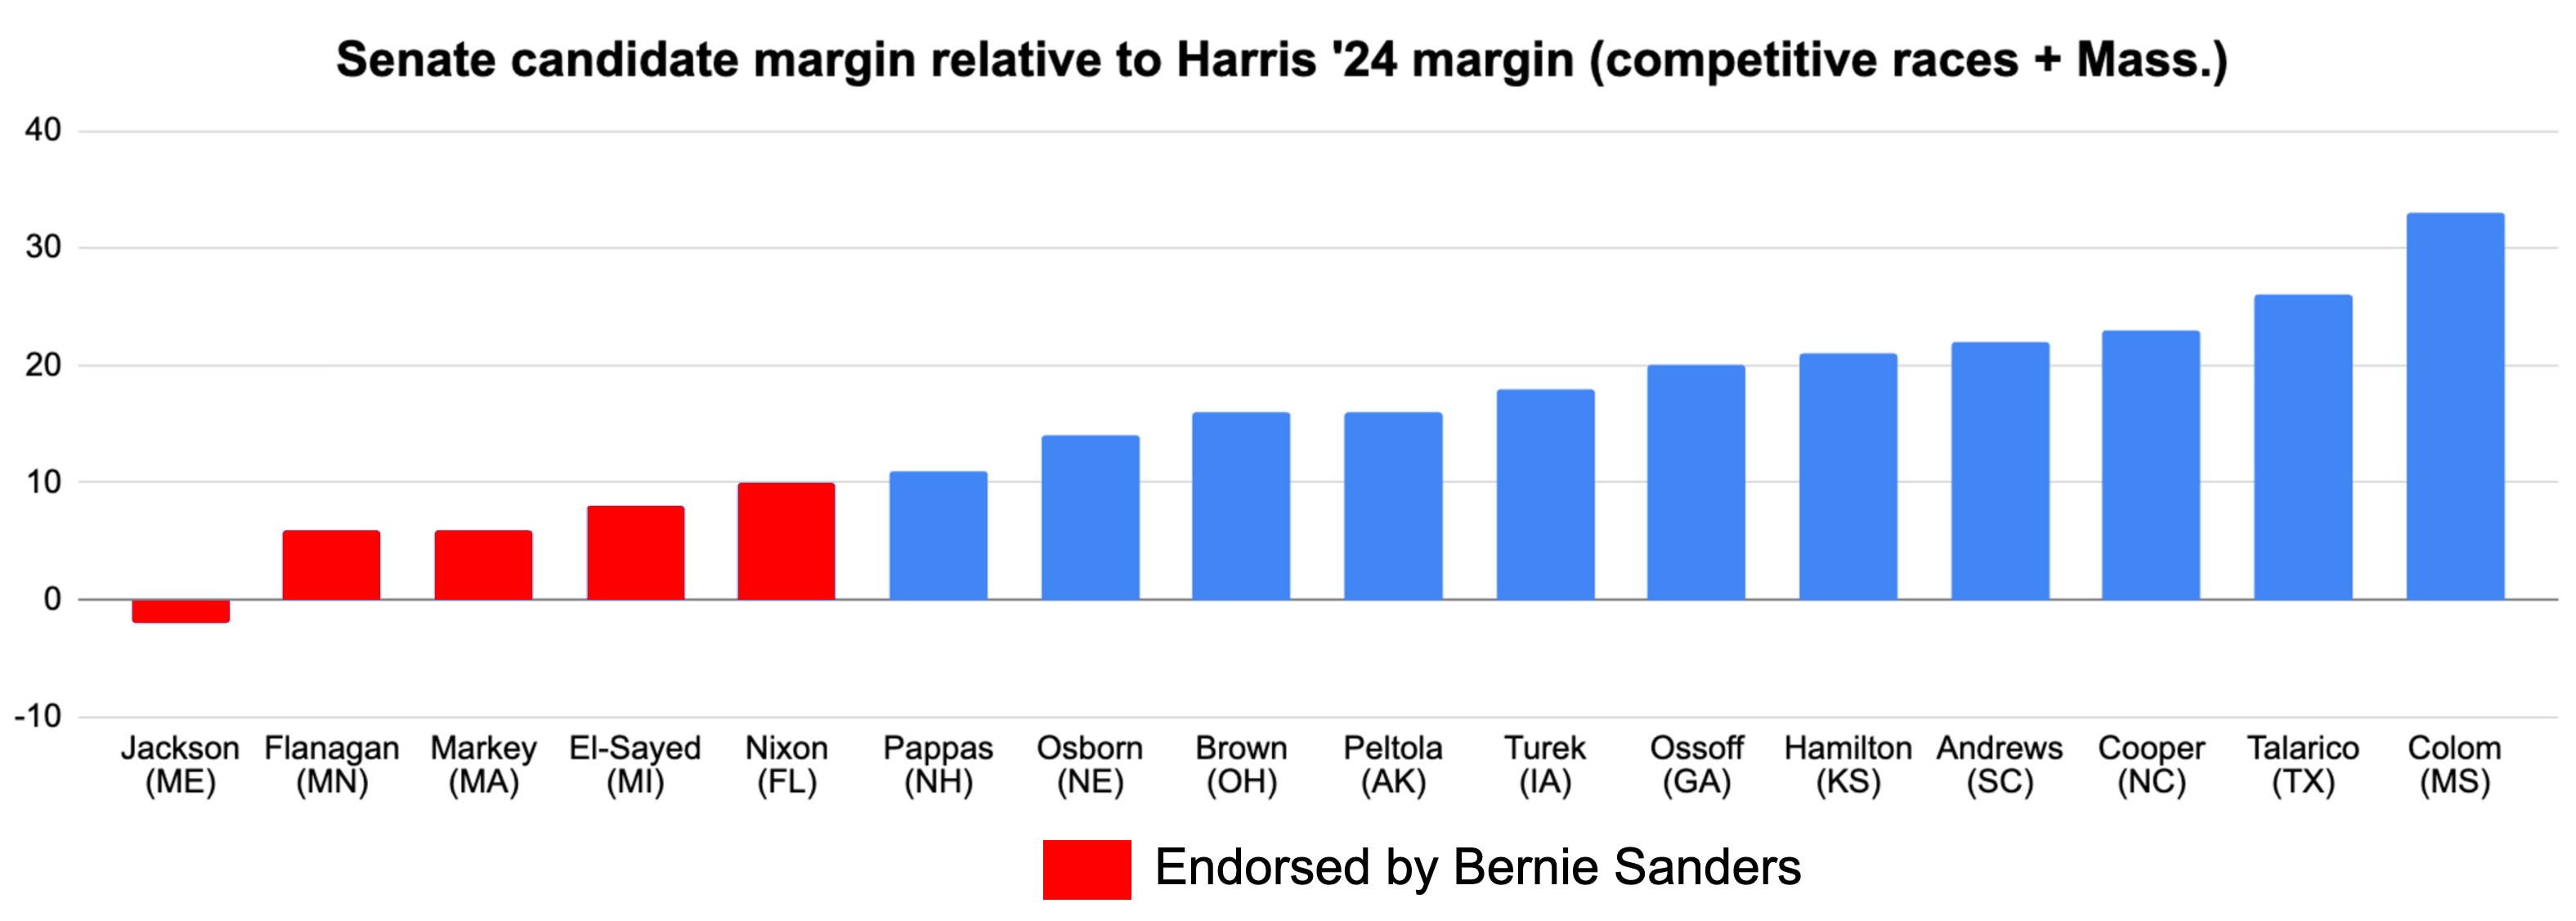
The first metric I wrote about in August was a Senate candidate’s performance relative to Harris’ performance in 2024. So: If Trump won a state by five in ‘24, and a Democrat won that state by ten last night, that’s a 15 point swing towards the Democrat. As always, I had to make a few choices that I’ll address in this footnote,1 but this was a remarkably clean data set. And, FWIW: The average swing towards Democratic Senate candidates last night was *16.2 points *— so much for the “there are no swing voters” theory!
A few notable things:
Leftist candidates did every bit as poorly as I expected, and I’ll write about that more in a minute (and for the next several years);
My
predictionthat James Talarico would look like a political genius because he ran against a straight-up criminal proved to be correct;Shout out to the poor performance by Oregon’s Jeff Merkley, a guy who has so distinguished himself as a moron that he’s been singled out for mockery on this blog on
threeseparateoccasions.
Which of these candidates count as “leftists”? That’s in the eye of the beholder, but a good proxy is: The candidate is a leftist if they were endorsed by Bernie Sanders. Bernie is the DSA’s extremely-elder statesman, and his blessing is why non-DSA members like Troy Jackson and Abdul El-Sayed garnered heavy DSA support. Here is the same chart with the Bernie-endorsed candidates shown in red:
And here’s the same data in an easier-to-read format — in this chart, I removed the races deemed an “easy win” by The New York Times. This not only makes the font easier on the eyes: It acknowledges that non-competitive races can be weird, since there often wasn’t much real campaigning, and the opponent was usually some replacement-level state senator who volunteered to be tossed into the wood chipper for reasons known only to them and their God. So: This is the *exact same data *with those races removed, except I kept Markey in because I wanted to include all five Bernie-backed candidates:
The second metric I wrote about in August was a candidate’s performance relative to other statewide candidates in their state. Not every Senate candidate had a gubernatorial candidate to be compared to, and in some cases, I’m dealing with incomplete data: Substantial vote is still out in Oregon, Colorado, New Hampshire, and Nebraska.2 The result was a less-complete and more idiosyncratic data set, but here it is:
I guess I owe an apology to Jeff Merkley, who at least did better than his state’s unpopular governor, Tina Kotek. I think I need to find out what the hell is going on in Oregon — on a night when red arrows on the *New York Times’ *“vote shift” map were as rare as a steakhouse in Eugene,3 Kotek’s map looked like this:
And here’s that same data set with the Sanders-endorsed candidates shown in red:
There is no question that moderate Democrats did better than leftist Democrats. The Bernie-endorsed Senate candidates were the worst performers in the whole country in competitive races. Not a single Bernie-endorsed candidate did as well as a normie Democratic gubernatorial candidate in their state. Other people are 𝕏parsing 𝕏the same 𝕏data 𝕏different ways, but the signal is always the same: Normies do better than leftists.
But frankly: That’s old news. The reason why I tossed myself an alley-oop pass back in August that I knew I would be able to dunk home today is because the notion that far-left politics are broadly unpopular in America is one of the most well-established theories in all of political science. We honestly did not need this data set; there was already exhaustive data demonstrating this truth, and I have been compiling that data and loudly mocking politicians who can’t put two-and-two together for several years. Anyone still making the “secret leftist majority” argument is either a propagandist or a Flat Earther and should be ignored.
And the message is a hopeful one for Democrats: There is a way forward. Voters have resoundingly rejected MAGA — they seem ready to move on. Democrats can capitalize on Republicans’ well-deserved unpopularity if they pursue results, not fringe ideology. And no presidential candidate should be wooing the endorsement of Bernie Sanders, a man who has established himself as King Midas But For Shit Instead Of Gold. The voters have spoken, and they spoke with remarkable clarity; now, Democrats will decide if they’re going to listen.
As I write, not all of the vote is counted, and it won’t be fully counted for a few more days, but I didn’t want to wait until next week to write this column. So, for states where <95% of the vote is counted as of this writing, I used the New York Times’ most recent estimate of the final vote margin. That didn’t change much — it was just a point or two here and there. The states were: Oregon, Colorado, Rhode Island, Massachusetts, Maine, New Hampshire, and Alaska.
In Montana and Nebraska, the primary opponent to the Republican was an independent, not a Democrat. I put independent Dan Osborne of Nebraska into the data set because that was still a two-person race — there simply wasn’t a Democrat in that race. But Montana was a three-person race: An independent got 37 percent and a Democrat got 12. That was just too messy — I threw Montana out (of the data set — they remain in the union).
As I write, a winner has not been declared in Mississippi, but that doesn’t hurt the data set: The margin in that race is almost certainly going to be “zero” regardless of who wins.
I also threw out three-way races in Rhode Island, Idaho, and Alaska, just as I threw out the three-way race in Montana.
I used to live in Eugene! It’s very nice…but awfully Eugene.