I turned 69 this year, which means I’ve been watching the dollar get mugged in broad daylight since 1957.
So I built something. Not a book, not a podcast episode — an actual interactive tool. It’s called ** the Dollar Time Machine**, and the concept is stupidly simple: pick a year, pick an amount, and it tells you what that money was actually worth then versus now — measured against everyday prices, housing, gold, silver, the Dow, the S&P 500, and even Bitcoin. The stock indexes allow you to include or exclude fully investing dividends. The difference is astounding. I set the default year to 1957 because it’s the year I showed up and I wanted to see the truth in one place.
👉 Try it yourself: dollartimemachine.com
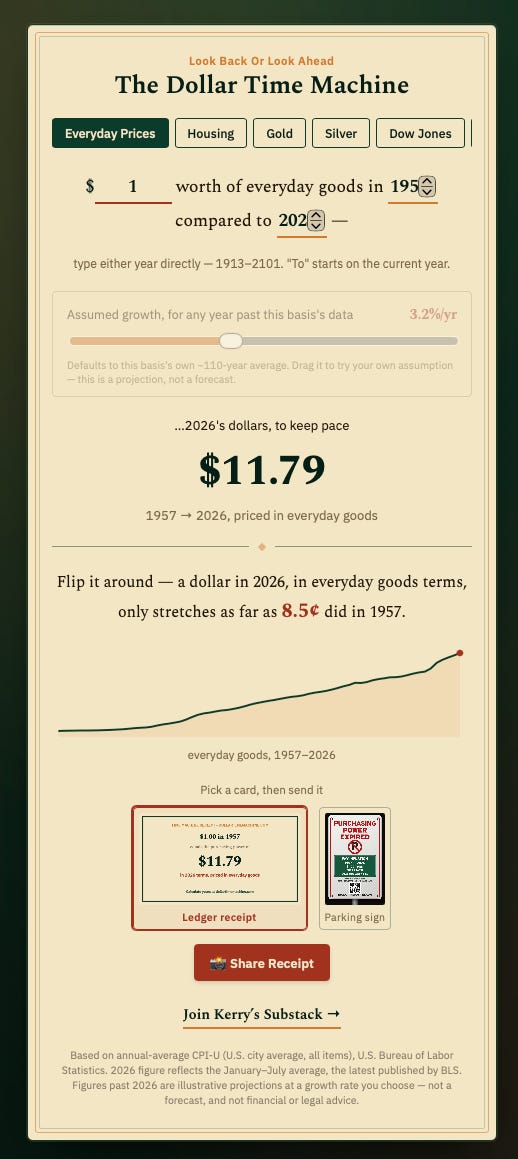
Here’s the receipt, printed from my own birth year to today:
A dollar of everyday goodsin 1957 needs to be**$11.79today just to break even. That’s the “official” inflation number — and it’s thetameone.A dollar of housingin 1957 needs to be$40.29today. Median home price back then: about $10,300. Today: north of $415,000. Housing didn’t just track inflation — it lapped it four times over.A dollar of goldneeded to become$129.33**. Gold was legally pegged at $35.25/oz when I was born. It’s trading north of $4,500 now.A dollar of silverneeded to become**$57.24**. Silver back then was still trading at its old monetary face value — $1.29/oz, because that’s literally what the Coinage Act of 1792 said a dollar was worth in silver. It didn’t break above that “just a dollar” line until 1967. Everything since then is the real market finally showing up.A dollar in the Dowturned into roughly**$124**. A dollar in theS&P 500, price only (no dividends), turned into about**$171**— and if you reinvested dividends the whole way, it’s way, way higher.A dollar in Bitcoin— well, Bitcoin didn’t exist in 1957. Nothing did, until 2009. That’s the whole point of the tool, actually: it shows you what’s areal, centuries-old store of value, and what’s a brand-new experiment still writing its own history.
Sit with that for a second. The same “dollar” bought you eleven times more stuff, forty times more house, and a hundred-plus times more gold and stocks — depending entirely on which dollar you’re talking about. There’s no such thing as the dollar.” There’s just the specific thing you happened to hold onto.
I’ve spent decades telling people the dollar is a melting ice cube. That’s a metaphor. Metaphors are easy to nod along to and just as easy to forget five minutes later.
Plug in your birth year. Plug in the year you bought your first house, or the year your kid was born, or the year you started stacking metal. Toggle between the seven measuring sticks and watch the story change completely depending on which one you pick — because “how much did I lose to inflation” and “how much did I lose by holding cash instead of an asset” are two very different questions, and most people have only ever been shown the first one.
It also does the thing nobody else’s inflation calculator does: it lets you run it forward, not just backward. Pick a future year, drag the growth-rate assumption, and watch what today’s dollar might need to become by the time your kids are your age. It’s not a forecast — it’s a way to actually feel what compounding does over a lifetime instead of just being told it’s important.
Screenshot yours, drop it in the comments, or tag me when you post it. I want to see what year everyone picks — and I want to see the look on your face when you find out what a 1980 dollar in housing turned into.
— Kerry
P.S. — If this is the kind of thing that’s useful to you, the deeper dives on where gold, silver, and the metals story go from here are where FSN’s Insider Advantage really kick in. Worth a look if today’s numbers rattled you even a little.