“Let’s think the unthinkable, let’s do the undoable. Let us prepare to grapple with the ineffable itself, and see if we may not eff it after all.” – Douglas Adams
Hello everyone, and happy Friday! I hope you have good things planned for the weekend. 🍃
Stablecoin payments: the numbers
Newslettering after four years
Crypto is Macro Now offers ~daily commentary and updates on crypto’s evolving role in the changing geopolitical and financial landscapes. Plus links and more.
If you’re a premium subscriber, thank you!! ❤
Allium gives enterprises the simplest, fastest way to access onchain data, without building data pipelines or using patchwork solutions.
- → Book a demo:* https://www.allium.so/
And get weekly onchain data and more analysis like this from the Allium Research team on Substack
A new stablecoin report form Allium Research is always a good reason to reshuffle my content plan. It’s a long report so I’m just going to share a few of the charts, but you can take a look at the full document here.
(Allium is a sponsor of this newsletter, but they didn’t ask me to comment on the report – I’m doing so because it’s great work, and relevant to what I focus on.)
Some key takeaways:
**The stablecoin ecosystem is becoming more diverse. **Overall circulating supply grew by $1.2 billion (0.4%) in the first nine months of 2026, but that from giants Tether and Circle fell by $4 billion. The number of issuers with more than $1 billion outstanding climbed to 15, up from 11 in 2025.
(all charts from the Allium report: State of Stablecoins and Payments)
**Where stablecoins are held is also changing. **The amount concentrated on exchanges at the end of September dropped by 7% year-on-year, while that held in wallets jumped by more than 20%, to 45% of the total circulating supply.
**End-user activity is climbing. **Allium strips out automated activity, trading and operational transfers from raw onchain volume to get an idea of wallet-to-wallet transfers, roughly 2.5% of the total in value terms. This estimate of end-user activity was 48% higher in the first nine months of 2026 compared to the same period last year (even though supply was more or less flat), led by transactions on Tron.
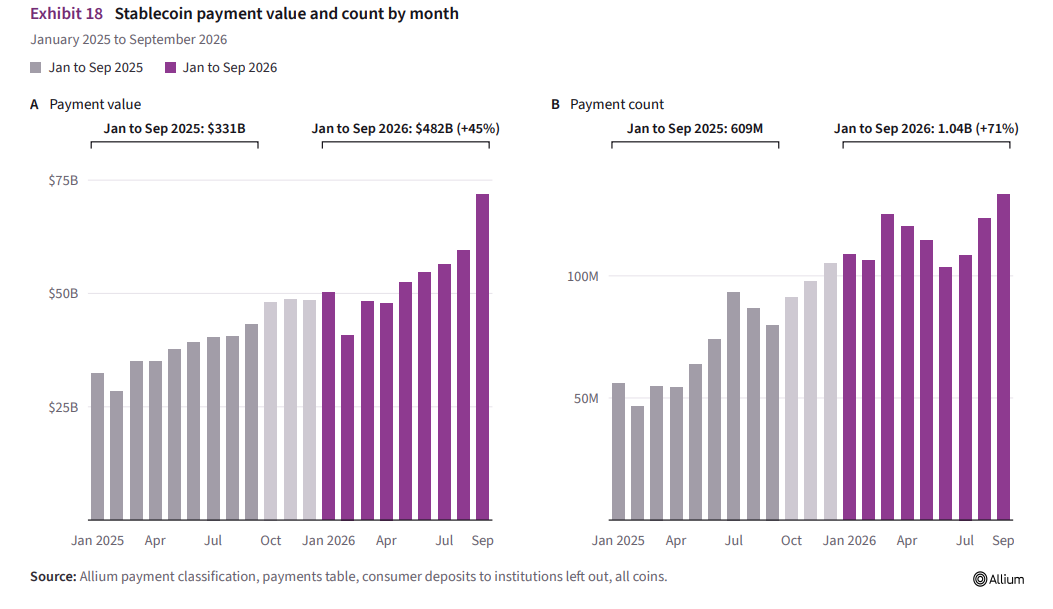
Of adjusted volume, roughly 20% is attributed to payments, which grew 45% year-on-year in volume through the first nine months of 2026 and more than 70% in number, while the average transfer size fell around 15%.
Consumer-to-consumer transfers are still the largest category of payments, up almost 60% in value in the first nine months of 2026, up 66% in number.
The report also has detail on agentic payments (growing in number but not value) and stablecoin card spend (up roughly 10x through September!), worth checking out.
A bigger takeaway is how much information can be gleaned from understanding and filtering onchain data, and how this can be funnelled into dashboards – something you don’t get with traditional, fragmented payments information.
As part of this newsletter’s fourth birthday commemoration (which I’m still finding hard to believe), I promised to share some thoughts on how I do what I do, and how that has changed over the years. I’m hoping this will be helpful to anyone else struggling with the weight of content production in an increasingly crowded environment – and that it will give you wonderful readers some insight into what my days are like, and why I feel so lucky.
Below, I’ll answer the questions I get asked most often. There will obviously be much that I leave out, not deliberately but in the interests of time – feel free to reach out on Substack Chat if there’s something you’re wondering about that I haven’t addressed. If I get enough interesting questions there, I’ll do a part 2.