The following analysis breaks down the Fed balance sheet in detail. It shows different parts of the balance sheet and how those amounts have changed. It also shows historical interest rate trends.
The Fed has quietly been doing Quantitative Easing since February. The pace of accumulation has slowed in recent months, and was even negative in August. When QE was turned back on, it was intended for purchases of Bills to keep liquidity high. As shown below, this is still happening with the Fed accumulating $29B of Bills in August. The net drop came from MBS and 5-10 year notes rolling off.
Figure: 1 Monthly Change by Instrument
Zooming out to 10 years and grouping the data by year shows the chart below. What you should notice is how quickly the Fed will un-do all the “hard work” in reducing the balance sheet during the next crisis. It took 4 years to reduce the balance sheet about $2.2T. However, in 2020, it took a few months to grow the balance sheet by $3T and 2 years to grow it by $4.5T.
So far this year, the Fed has increased the balance sheet by $90B. While this is a small increase relative to past years, it should be noted that the balance sheet is growing and not shrinking. This makes it harder for inflation to come down.
Figure: 2 Monthly Change by Instrument
The table below provides more detail on the Fed’s activities and its recent efforts to manage the balance sheet.
The biggest thing to notice is how the Fed has increased the holdings of Bills by $344B over the last year! That is an increase that should not go unnoticed. Why is the Fed focused on buying Bills? Bills are typically the most liquid asset in the Treasury issuance list, so it’s confusing why the Fed has stepped in for liquidity reasons.
Figure: 3 Balance Sheet Breakdown
The weekly activity can be seen below. It’s very obvious in this chart to see the continued buying of Treasury Bills each week.
Figure: 4 Fed Balance Sheet Weekly Changes
The chart below shows the balance on detailed items in Loans and also Repos. These were the programs set up in the wake of the SVB collapse. All of the programs have dropped down to zero at this point, but as mentioned above, the Fed would like to see more usage of the Repo market (Standard Repo Facility or SRF).
Figure: 5 Loan Details
Yields have been fluctuating within a band since Sept 2022, ranging mostly between 3.25% and 4.75%. That range was broken in June with 30-year rates breaking decisively over 5% and the 10-year breaking above 4.5%. This is why the Treasury has stepped into the market. They are seeing cracks in the bond market and it could have major implications.
Figure: 6 Interest Rates Across Maturities
The yield curve spread has also started to widen again which means investors are demanding more compensation for keeping dollars locked up for longer periods.
Figure: 7 Tracking Yield Curve Inversion
The chart below shows the current yield curve, the yield curve one month ago, and one year ago. Again, it is clear to see how the yield curve has started to steepen. This makes the Treasury’s job much harder.
Figure: 8 Tracking Yield Curve Inversion
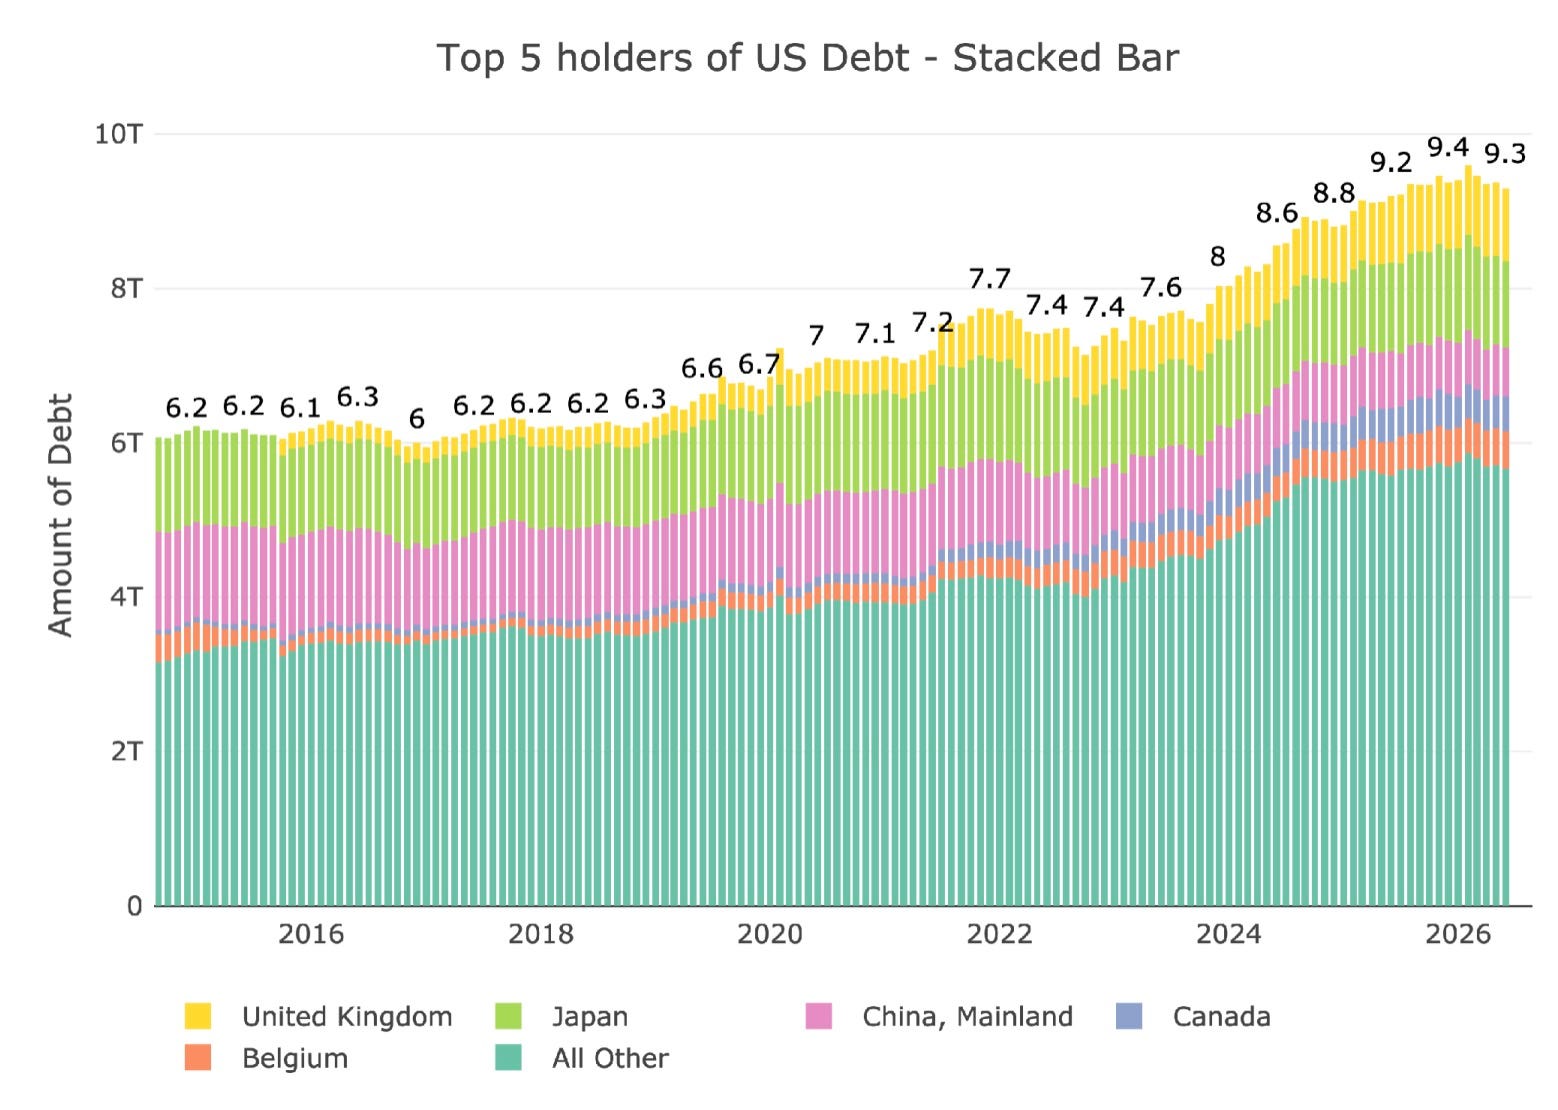
Perhaps the most concerning thing is the dropping interest in US Debt internationally. Total holdings of US Debt has actually fallen from the $9.4T peak seen in Q1. While the US treasury issues ever more debt, it is a very bad sign to see foreign holders not stepping in to buy.
Note: data is updated on a lag. The latest data is as of June
Figure: 9 International Holders
The chart below shows a breakdown of the bigger countries. China’s US Debt holdings have fallen to $630B, a drop of $100B since last year. The UK now holds more US Debt than China does. Japan holdings have basically been flat for the last decade floating between $1T and $1.25T. The Japanese cannot turn into sellers or it would add even more pain. This is why the US has stepped into the currency market as well.
Figure: 10 Average Weekly Change in the Balance Sheet
The final plot below takes a larger view of the balance sheet. It is clear to see how the usage of the balance sheet has changed since the Global Financial Crisis. This also highlights the rapid increase and steady decrease. The Fed can never actually shrink its balance sheet back to the previous state, it just does minor reductions when it can before the next crisis blows it up again. Based on the trajectory of the Fed balance sheet, that next crisis might be closer than anyone thinks!
Figure: 11 Historical Fed Balance Sheet
Warsh has come in with a new message: after 5+ years, the Fed is ready to get inflation under control. That’s much easier to say than do. This is really a situation of math more than anything else. If the Fed raises rates then the government borrowing costs will continue to increase. That cannot happen. The only option is to keep rates flat or lower them. They just need the right excuse.
Federal Reserve Chairman Kevin Warsh used his Jackson Hole podium on Friday to draw a bright line around the central bank’s credibility, declaring that the long-promised 2 percent inflation goal on the Personal Consumption Expenditures (PCE) index is “a firm, fixed target.” Price stability, he said, “is not self-executing…it’s the Fed’s job to deliver stable prices, no excuses.” Investors took note as gold touched an intraday high near $4,612 per ounce on Thursday, a reminder that markets continue to hedge against the possibility that inflation remains well above the Fed’s comfort zone.
PCE inflation is running 3.7 percent year-over-year, with the six-month pace running above 4 percent. Even after cooling from post-pandemic peaks, 54 percent of the PCE basket has risen more than 3 percent in the past year, compared with a pre-COVID norm of 32 percent. Warsh said that the responsibility for “65 months of sustained elevated inflation” sits squarely with the central bank. Comparable Consumer Price Index data show the same stubborn pressure, a sign that price growth has not yet meaningfully improved.
Warsh called the labor market “broadly consistent with full employment.” Business investment in equipment and intangibles is advancing at a 9 percent clip, more than half of it tied to artificial-intelligence projects. S&P-listed firms have booked profit growth above 20 percent, leaving margins “quite elevated.” Corporate-bond spreads and leveraged-loan spreads trade near the low end of their historical ranges, while July’s Senior Loan Officer Survey flagged easier commercial-and-industrial loan standards.
Separately, Warsh addressed the Fed’s own communication practices. He warned that routine forward guidance can trap policymakers and market participants in a “Hall of Mirrors,” in which each side reacts to the other’s signals rather than to the underlying economy. He argued that short-term interest rates should remain the predominant tool of monetary policy, adding that balance-sheet experiments and other unconventional measures “should otherwise be used sparingly, if at all.” Referring to monetary traditions that predate quantitative easing, he said “money matters” and urged the Fed to watch the money created by both the central bank and the broader financial system.
Warsh also flagged artificial intelligence as a “new variable” that could influence productivity, noting that annualized token sales at the two leading AI labs already exceed $100 billion, an increase of more than 500 percent from a year earlier. Faster productivity could help contain prices over time, though the pace of AI-related investment has raised questions about overheating, a concern also visible in gold’s recent ascent.
Whether the Fed can tame prices without another round of unconventional policy remains to be seen. For now, investors appear to be hedging against that uncertainty by continuing to hold and buy gold, an asset that has weathered inflation and downturns for decades.
QTR’s Disclaimer**:** Please read my full legal disclaimer on my About page here.
Contributor posts and curated posts have been hand selected by me, but have not been fact checked and are the opinions of their authors. They are either submitted to QTR by their author, reprinted under a Creative Commons license with my best effort to uphold what the license asks, or with the permission of the author.
I cannot guarantee the accuracy of any or all facts and figures included in this article though I made my best effort to get them right. I have been wrong before and will be wrong again, and encourage you to always double check, do your own research and speak to a licensed financial professional, which I am not.
This is not a recommendation to buy or sell any stocks or securities, just my opinions. I often lose money on positions I trade/invest in. I may add any name mentioned in this article and sell any name mentioned in this piece at any time, without further warning. None of this is a solicitation to buy or sell securities. I may or may not own names I write about and are watching. Sometimes I’m bullish without owning things, sometimes I’m bearish and do own things I’m bearish on. Just assume my positions could be exactly the opposite of what you think they are just in case. If I’m long I could quickly be short and vice versa. I won’t update my positions.
Also as of May 20, 2026 I am attempting to no longer actively trade as much as I once did ( read my story here). My eventual goal is for investing/saving to be mostly done by recurring contributions, mostly to sector ETFs and a few select equities, trusted third parties who oversee my accounts, and advisors. Such advisors or funds, through individual equities, options, index funds, mutual funds, ETFs, or other securities, may have positions in, exposure to, or holdings of names mentioned herein that I know nothing about. Basically, via index funds, ETFs and individual equities it is possible I could own, have exposure to, or not own anything at any point. As of the same date, May 20, 2026, in an attempt to lead a healthier lifestyle, I’ve also excluded myself from fantasy sports, sports betting, online and in-person casinos and prediction markets.
Again. All positions can change immediately as soon as I publish this, with or without notice and at any point I can be long, short or neutral on any position. You are on your own. Do not make decisions based on my blog. I exist on the fringe. If you see numbers and calculations of any sort, assume they are wrong and double check them. I failed Algebra in 8th grade and topped off my high school math accolades by getting a D- in remedial Calculus my senior year, before becoming an English major in college so I could bullshit my way through things easier.
The publisher does not guarantee the accuracy or completeness of the information provided in this page. These are not the opinions of any of my employers, partners, or associates. I did my best to be honest about my disclosures but can’t guarantee I am right; I write these posts after a couple beers sometimes. Many times I edit after my posts are published because I’m impatient and lazy, so if you see a typo, check back in a half hour.
Also, again I just straight up get shit wrong a lot. I mention it multiple times because it’s that important you understand.