The analysis below covers the Employment picture released on the first Friday of every month. While most of the attention goes to the Headline Report, it can be helpful to look at the details, revisions, and other reports to get a better gauge of what is really going on.
The jobs report showed a meager gain of 29k jobs in the month of September. This follows the “strong” August report of 162k which has now been revised down to 133k jobs. The bigger surprise is the second strong month of the household survey which showed a gain of 406k which followed 569k added in August.
Figure: 1 Primary Report vs Household Survey – Monthly
Despite the massive outperformance in the Household Survey, when looking at the YTD number, it still underperforms. For the year, the Headline Report shows a gain of 612k vs the Household Survey which shows a loss of 840k.
So, even with two very strong months, the Household Report still shows an extremely weak job market. Outside of Covid, this is the worst year for jobs since at least 2010 according to the Household Report. It’s also the only year where the two reports are moving in opposite directions.
Figure: 2 Primary Report vs Household Survey – Annual
The BLS publishes the data behind their Birth/Death assumptions (formation of new business). The data showed that the BLS assumed a loss of 190k jobs for September. This is the first month since March where the assumed jobs was actually negative.
Figure: 3 Primary Unadjusted Report With Birth Death Assumptions – Monthly
Despite the negative assumptions, we are now in the second year where the assumed jobs is positive where the actual jobs is negative. This is not a good trend to see.
Figure: 4 Primary Unadjusted Report With Birth Death Assumptions – Monthly
Unfortunately, despite being highly unreliable, the Headline report is the best data we have for the more recent periods. Furthermore, this is the data the Fed uses to shape its policy. Even though Warsh is trying to be more discreet about how the Fed is going to work, and he has clearly stated that inflation is the primary focus, the weak labor market will definitely impact how the Fed makes its decisions.
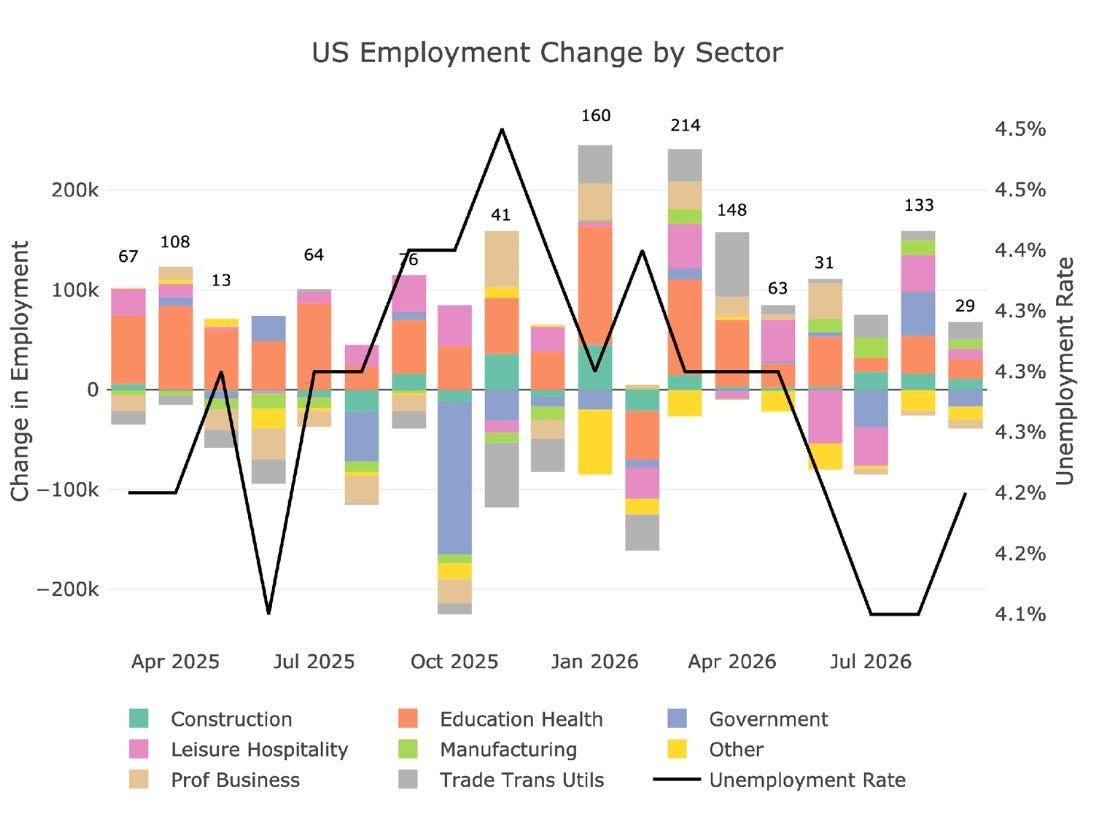
The unemployment rate increased to 4.2%.
Figure: 5 Change by sector
Across the 8 job categories tracked in the headline report, it was a split outcome for what was above trend vs below trend. Government was below and Manufacturing was above which is generally a good outcome. That said, the overall weakness of the report takes precedence over any micro trends within the report.
Figure: 6 Current vs TTM
The table below shows a detailed breakdown of the numbers.
Figure: 7 Labor Market Detail
This has been one of the biggest stories of the jobs report each month. The Headline Report has been constantly revised with big changes in the months following the release. While July was revised up from the original report (staying negative), May, June, and August were all revised lower.
Figure: 8 Revisions
Over the last twelve months, jobs have been revised down by about 35k per month!
Figure: 9 Revisions
Another level of detail in the Household report shows full-time vs part-time job holders. The data shows both full-time and part-time jobs getting added in September.
Figure: 11 Full Time vs Part Time
The chart below shows data going back to 1955.
Figure: 12 Historical Labor Market
The labor force participation rate is still well below the highs before the Global Financial Crisis. This month showed it moving up to 61.8% from a recent low of 61.4%. It is good to see the improvement, but it is still well below where it should be.
Figure: 13 Labor Market Distribution
The recent job report was very weak. The Fed is keeping inflation front and center, but they need to be careful. The labor market has been weak for a long time now and if things get worse as the Fed continues to raise rates, they may be forced to lower very quickly. This would be a big credibility hit for the Fed.
Not to mention they are creating major headaches for the Treasury as they drive borrowing costs higher on a debt that cannot sustain higher borrowing costs.
QTR’s Disclaimer**:** Please read my full legal disclaimer on my About page here.
I also may or may not own names I write about and are watching. Sometimes I’m bullish without owning things, sometimes I’m bearish and own things I’m bearish on. Just assume my positions could be exactly the opposite of what you think they are just in case. If I’m long I could quickly be short and vice versa. I won’t update my positions.
I cannot guarantee the accuracy of any or all facts and figures included in this article though I made an effort to get them right. I have been wrong before and will be wrong again, and encourage you to always double check, do your own research and speak to a licensed financial professional, which I am not.
Contributor posts, guest posts and curated posts have been hand selected by me, but have not been fact checked and are the opinions of their authors. They are either submitted to QTR by their author or reprinted under a Creative Commons license with my best effort to uphold what the license asks, or with the permission of the author.
Since 2026, I have been making an attempt to no longer actively trade as much as I once did ( read my story here). In an attempt to lead a healthier lifestyle, I’ve also excluded myself from most fantasy sports, sports betting, online and in-person casinos and prediction markets.
My goal is for my investing/saving to be done by recurring contributions mostly to sector ETFs and a few select equities, trusted third parties who oversee my accounts, and advisors. Such advisors or funds, through individual equities, options, index funds, mutual funds, ETFs, or other securities, may have positions in, exposure to, or holdings of names mentioned herein that I know nothing about. Basically, it is possible I could own, have exposure to, or not own anything, at any point.
You are on your own. Do not make decisions based on my blog. I exist on the fringe. Again, I get shit wrong a lot, both in the market and in life, but am trying my best. If you see numbers and calculations of any sort, assume they are wrong and double check them. I failed Algebra in 8th grade and topped off my high school math accolades by getting a D- in remedial Calculus my senior year, before becoming an English major in college so I could bullshit my way through things easier. Hence, I am a writer. I write these posts after a couple beers sometimes. Many times I edit after my posts are published because I’m impatient and lazy, so if you see a typo, check back in a half hour. Thanks, you’ve been a great crowd and don’t forget to tip your servers.