There are two possible outcomes: if the result confirms the hypothesis, then you've made a measurement. If the result is contrary to the hypothesis, then you've made a discovery - Enrico Fermi
Life is wonderful because it is made of discovery.
And to me, that is exactly the point of analysis. Analysis is not about confirming the hypothesis you started with. The real pleasure comes when the evidence forces you to change your mind, when the result contradicts what you expected and reveals something you had not seen before.
I have spent my entire professional life analyzing businesses, partly out of passion, partly as a business executive and educator. What has always fascinated me is going beneath the surface to understand the structural patterns that explain what is actually happening.
That is where analysis becomes discovery.
This is where I stand.
NVIDIA’s Q2 print just came out, and to me it is the epitome of the Map of AI.
The Map of AI is my most rigorous attempt to track where we actually are in the AI Supercycle. Not where the hype says we are. Not where the skeptics want us to be. But where the underlying system is moving.
Because the real question is structural, and answering it requires nuance.
AI has become so divisive and politicized that most of the debate has collapsed into two camps. On one side, AI is snake oil: a speculative bubble, socially destructive, and largely a scam. On the other, AI is treated almost as an article of faith: the technology will transform everything, therefore every investment, company, and narrative attached to it must somehow be justified.
Neither position is analytical. And neither is particularly useful.
They do not help us understand what is actually happening, where value is accumulating, where bottlenecks are forming, what is durable, what is temporary, and where genuine excess is beginning to emerge.
I subscribe to neither camp.
My job as an analyst is to deconstruct the system. To separate structural change from speculation, infrastructure from narrative, durable economics from temporary scarcity, and technological transformation from financial excess.
If the AI Supercycle moves into genuine bubble territory, you will hear it from me.
If the evidence instead shows that AI is becoming one of the most consequential technological shifts of our generation, you will hear that too.
The objective is not to defend a thesis. It is to keep updating the map as reality changes.
The AI Supercycle is not simply the rise of better models, nor a software cycle that began with ChatGPT. It is the multi-decade buildout of a new computational infrastructure layer that is progressively reorganizing the economy around machine intelligence.
That buildout stretches from energy and physical infrastructure through semiconductor equipment, foundries, memory, silicon, networking, compute, models, routing, agentic systems, distribution and settlement. Capital moves down the stack to build the infrastructure; intelligence becomes cheaper and moves upward through it; applications create new demand; and that demand pulls another round of infrastructure behind it.
That is what makes this a supercycle rather than a normal technology cycle. A normal product cycle can often be understood through adoption: a technology appears, customers buy it, competitors enter, margins normalize. Here, software demand is forcing a reconstruction of the physical and financial layers beneath it, while falling intelligence costs continuously expand what can be built above it.
But there is not one smooth AI curve. The better mental model is one supercycle composed of many S-curves. Individual nodes overshoot, correct, refinance, commoditize or disappear while the larger system keeps climbing. A correction in one node is therefore not automatically a verdict on the cycle.
That distinction is the premise of this map.
Before the story, the reading.
On a six-gauge instrument measuring how the AI buildout is financed, money visible or hidden, self-funded or borrowed, taken out or trapped inside the system, the needle sits at 56 out of 100: stretched. Not calm, and not breaking.
The structure remains remarkably sound wherever you measure it in cash generation and increasingly fragile wherever you measure it in refinancing. There is effectively a hard stop at 70 that financing strain alone cannot cross. To push the system beyond it, something more fundamental has to fail: demand.
And this quarter, demand did not fail.
The dispersion matters more than the average. There is roughly a 70-point gap between the calmest and hottest readings across the instrument. Some nodes remain extraordinarily well funded; others are approaching the edge of their financing capacity. That spread is the finding.
So the useful question is no longer simply, Is AI a bubble? It is: where is the strain, who is financing whom, where are the durable rents, which rents are temporary, and through which joints would stress propagate if demand eventually did weaken?
For most of the AI boom, the default historical comparison has been 1999. The logic is obvious: extraordinary valuations, enormous capital commitments, uncertain monetization and a technology whose long-term importance does not protect investors from paying too much for it.
1999 gets one thing right: a transformational technology and financial excess can coexist. The internet survived the dot-com crash. Many of the companies financed around it did not. But 1999 remains too software-centric for what is happening now.
The analogy increasingly surfacing in 2026 is 1973. That comparison has become more plausible as energy, inflation and physical infrastructure have moved toward the centre of the AI debate. Reuters Breakingviews, for example, explicitly compared the risk of an energy shock derailing AI investment with the stagflationary dynamics of the 1970s.
The argument is stronger than the dot-com comparison. AI infrastructure increasingly depends on electricity, grid access, cooling, HBM, advanced packaging, transformers, land and cheap enough capital. A sufficiently violent repricing of one of those inputs could attack both operating economics and the financing structures behind them.
But 1973 is still the wrong master analogy. It describes a mature technological system hit by an external resource shock. The cars already existed. The highways already existed. The industrial system was already built. Oil attacked the economics of operating it.
AI is in a different phase: the network itself is still being constructed. Compute is expanding, model architecture is changing, inference economics are collapsing, new application surfaces are emerging, sovereigns are becoming a major buyer, and the deepest physical layers continue to confirm the same underlying demand curve.
That does not make an energy or financing shock irrelevant. It makes 1973 a useful failure mechanism inside the supercycle, not the best description of the supercycle itself.
The stronger analogy is 1846 and the British railway mania. Railway investment approached 7% of British GDP. More track was authorized in two years than the country could absorb for decades. Capital ran far ahead of near-term returns. Speculation followed. Panics followed. Investors were ruined.
The railway was not.
The mania financed the network. The panics transferred ownership of it. The network survived and repriced the cost of distance for an entire economy.
Hold all three at once: the mania can be real, the financial losses can be real, and the infrastructure can still be transformative.
There is therefore a useful hierarchy among the analogies. 1999 explains valuation excess. 1973 explains one possible input shock. 1846 explains the supercycle itself.
There is one more reason the railway analogy matters. Out of that wreckage came financiers who reorganized and refinanced the infrastructure itself.
Keep that detail. It becomes the centre of the map.
The AI Supercycle is no longer developing as one global stack. It is separating into two increasingly distinct industrial systems.
The US-anchored stack runs broadly from ASML to TSMC to Nvidia/AMD to the clouds to the labs. The China-anchored stack runs through SMIC, CXMT, Huawei and the Chinese open-weight ecosystem, with memory one of the thinner points in the geopolitical fence between them.
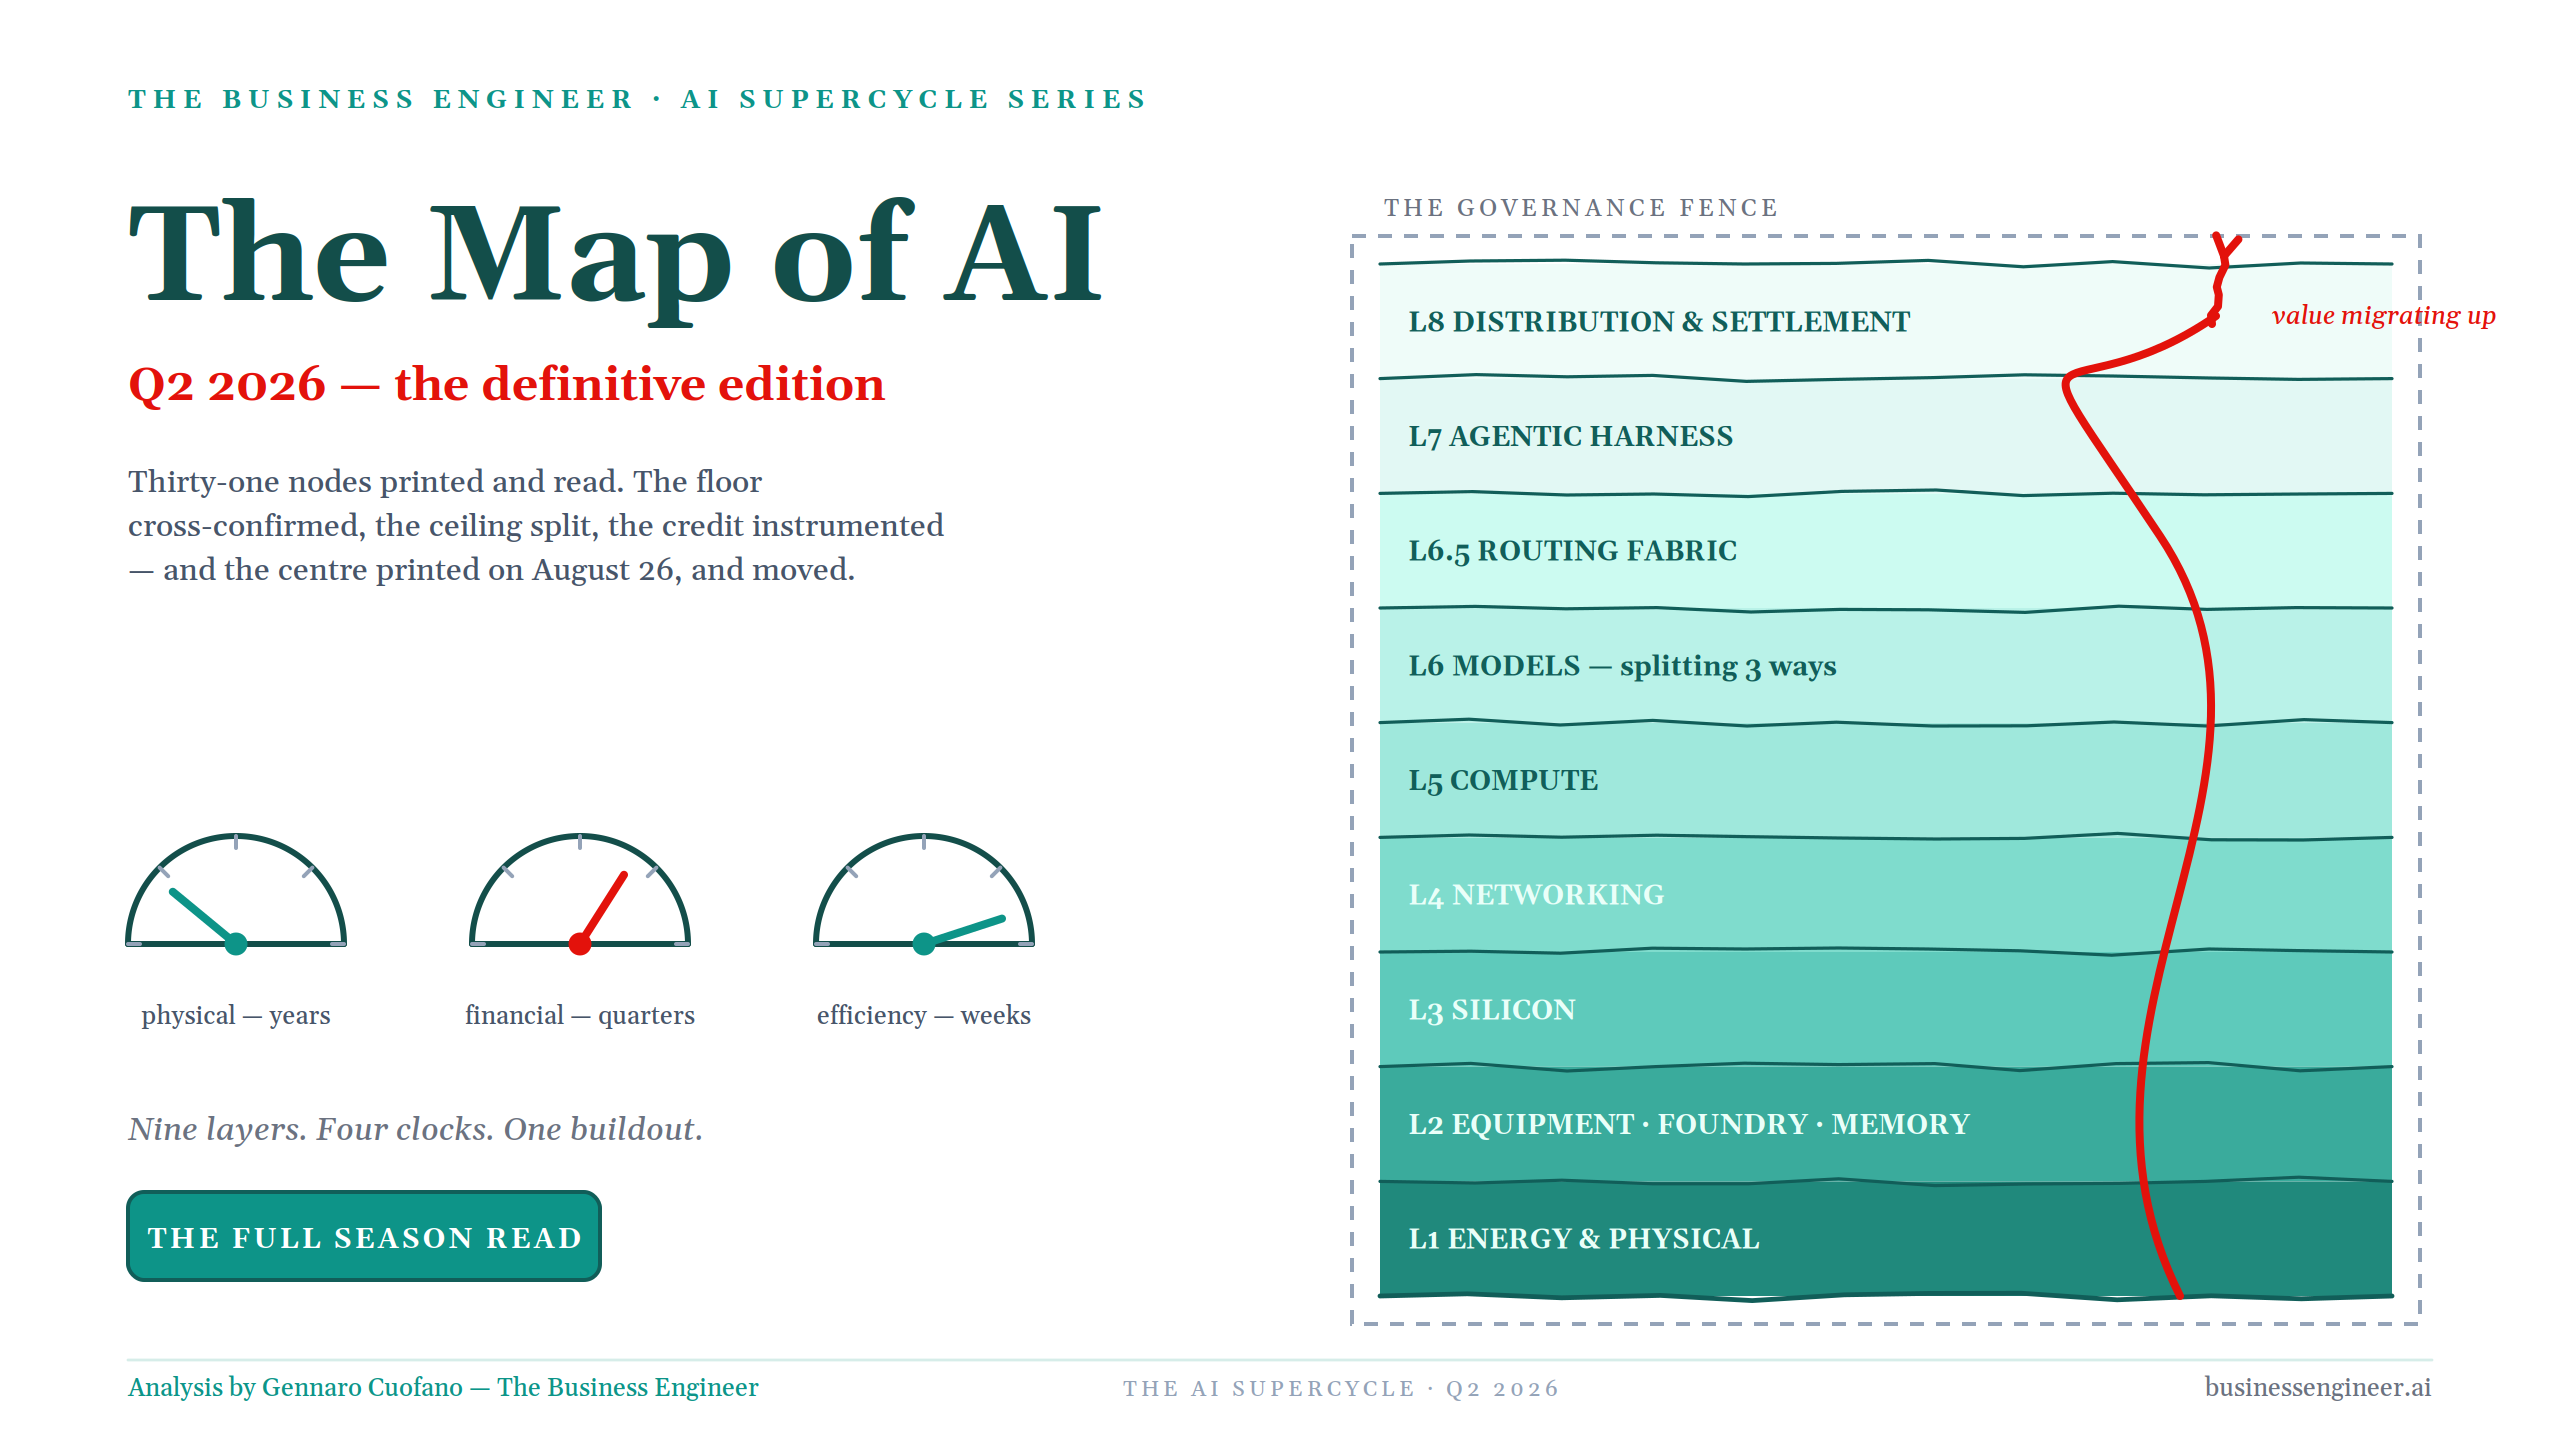
Governance is therefore not another layer sitting on top. Governance is the fence around the stack. Export controls, deemed-export rules, data residency, antitrust and sovereignty cut horizontally through alliances and supply chains. Sovereign programs in Korea, Japan and Europe and Gulf capital through actors such as G42 and HUMAIN make that increasingly visible.
And demand now comes from three buyers rather than one: hyperscalers, enterprises and the state. The third matters because sovereign demand can be return-insensitive. It can establish a floor under strategic compute even when commercial returns would not justify the investment.
But a floor is not the same thing as a hurdle.
Inside that geopolitical frame sit nine economic strata: L1 energy and physical; L2 equipment, foundry and memory; L3 silicon; L4 networking; L5 compute; L6 models; L6.5 routing fabric; L7 the agentic harness; L8 distribution and settlement; with governance surrounding all of them.
Three rules follow. First, value migrates upward but concentrates at junctions, rails and seams, not necessarily in the models themselves.
Models can increasingly be rented; the routing junction can be owned. Second, the governance fence cuts across every layer. Third, the credit map is not the technological layer map. Financial contagion can jump vertically through financing structures rather than move neatly from one adjacent layer to another.
That leads to one of the most important ideas in the deck: as models commoditize, value migrates toward the routing junction and the access-and-settlement seam.
To understand why the physical build remains so intense even while models become cheaper, follow an AI dollar through three stages: training, prefill and decode.
Training is amortized across enormous usage. Once spread, the cost can become pennies per token. Prefill is parallel and GPU-native, roughly five times cheaper than decode in the framework. Decode is different: sequential and heavily memory-bound. That means some of the hardest constraints sit precisely at HBM, CoWoS packaging and the leading-edge process nodes.
Then usage changes the arithmetic. A basic chat interaction may represent roughly 1x the computational load; reasoning can push the same question toward 5–20x; agentic workflows can push it toward 50–200x as software loops, calls tools, evaluates intermediate outputs and continues working without a human prompting every step.
This produces what I call the Kimi Paradox: the efficiency clock reduces the cost per token, but cheaper intelligence expands usage faster than it reduces unit price. Total spend can therefore rise while models become cheaper.
Commoditization is simultaneously the router’s tailwind and the physical floor’s order book.
That is why the sequence of bottlenecks matters. The constraint has migrated from packaging in 2023, to HBM in 2024, EUV in 2025, power in late 2025 and credit by July 2026. For the first time, the map is starting to show more than one constraint binding at once.
The core asymmetry follows: supply turns in years; demand turns in quarters. Every company building physical capacity today is effectively betting that the size and shape of today’s demand survive the years required to deliver that capacity. Shape can change quickly. Committed concrete cannot.
That is where the risk lives.
The map is built by reading individual company prints as probes into the system rather than asking each company to answer the entire AI question. Thirty-one nodes were read during the season, each compressed into a single falsifiable verb.
The resulting scorecard is revealing: Nvidia Banked; Microsoft Absorbed; Alphabet Stretched; Meta Overshot; Amazon Paid; Apple Skipped; Salesforce Conceded; CoreWeave Refinanced; Nebius Pre-funded; Cerebras Bought; Palantir Escaped; Qualcomm Reached; Supermicro Carried; Lumentum and Vertiv Armed; Equinix Commenced; SoftBank Funded.
The verb matters because it forces a local verdict. Alphabet stretching does not mean the supercycle stretched. CoreWeave refinancing does not mean the credit system is safe. Salesforce conceding the interface does not mean enterprise software disappears.
The node answers the question assigned to that node. The map decides what question to ask.
The strongest confirmation comes from the bottom.
ASML mints the machines. TSMC allocates the wafers. Nvidia, at the road’s end, increasingly finances the traffic it supplies. The first two are independent monopolistic institutions looking at the same physical demand curve.
ASML raised its FY26 outlook toward roughly €43–45 billion, with EUV demand reaccelerating and memory equipment surging. TSMC reported HPC/AI at roughly 61% of revenue, with CoWoS still a binding constraint and capex being raised into the same window.
Two independent monopolies pointing toward the same demand curve make the “demand is fake” argument extremely difficult to sustain at the physical floor.
But not every margin at the floor has the same durability. ASML and TSMC collect monopoly rent because very few institutions can perform their functions. Lumentum and Vertiv collect tightness rent because optics and power are temporarily scarce relative to the build. Both can generate exceptional economics; only the first category is protected when capacity catches up.
Memory shows how quickly scarcity can mutate into finance. A wafer increasingly creates far more economic value when directed toward HBM than toward commodity memory. Prices rose roughly 30–85% on comparatively modest bit growth, turning SK hynix, Samsung and Micron into toll booths on the build.
Then the memory producers signed sixteen take-or-pay contracts with price floors extending toward 2030, representing roughly $100 billion of minimum revenue.
At that point the risk changed form. The producer no longer asks, “Will someone buy this output?” It asks, “Will the counterparty behind the contract still be able to pay?”
Market risk became counterparty risk.
The bill also escaped the AI site. Qualcomm, a company that does not sit at the centre of AI infrastructure construction, saw more than $1.50 of EPS removed through the same memory squeeze.
That was the first clean proof that the inflation generated by the build was beginning to reach companies standing beside it.
Put the major builders on one instrument, capex as a percentage of revenue, and the financial strategies diverge dramatically.
Apple sits at roughly 2%. It has essentially opted out of the physical arms race, renting intelligence through a meter for roughly $1 billion a year and expensing it instead of building the infrastructure itself. Free cash flow remains around $110 billion. The striking point is not that Apple is “behind”; it is that opting out cleanly is itself a strategy, and the market has valued that strategy at around $5 trillion.
Tesla sits around 20.5%. But unlike Apple, it is neither cleanly outside the build nor economically strong enough to absorb it easily. The deck’s counterfactual is intentionally uncomfortable: roughly 68% of net income came from the mark on its sibling, while Tesla was funding 20.5% capex intensity from around a 1.4% margin. SpaceX, meanwhile, had already out-earned it. Apple skipped the build; Tesla became trapped beside it.
Amazon sits near 27%, with AWS generat…